
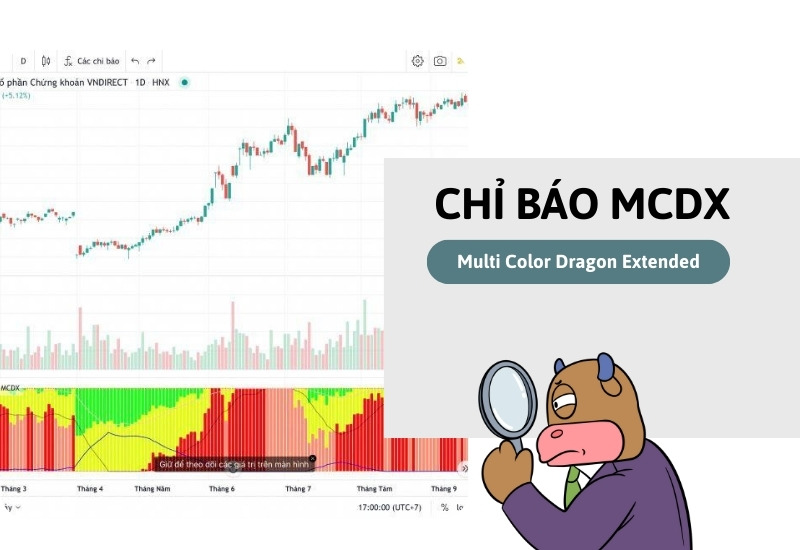
MCDX Indicator – Things not all investors know!
MCDX is an important tool to reflect cash flow fluctuations in the stock market, helping investors identify the ideal time to trade. In this article, let’s learn about the concept and how to use this indicator with DNSE!
What is MCDX indicator?
Learn about the MCDX Indicator
The MCDX indicator (short for Multi Color Dragon Extended ) is a technical analysis tool commonly used in the Vietnamese stock market to reflect the cash flow created in the market.
It helps investors identify cash flow trends investing in stocks and make appropriate trading decisions.
Meaning of the MCDX indicator
The MCDX indicator is very useful when choosing investment stocks, especially when you use a cash flow investment strategy. Based on the color of MCDX, investors can determine which stocks the investment cash flow is flowing to.
Furthermore, this indicator also helps you distinguish when and who is investing in stocks. This is important information for investors to consider. Each investor will have a different purpose and influence on the value and profitability of stocks.
Structure of the MCDX indicator
The MCDX indicator uses 3 colors to represent 3 main investor groups in the market:
- Red: Banker – represents large cash flow, has a strong influence on market trends.
- Green: Retail investors – represents short-term cash flows, often have psychological trends and are easily affected by market fluctuations.
- Yellow: Speculators – represents short-term cash flow, tend to enter the market when the market has strong fluctuations.
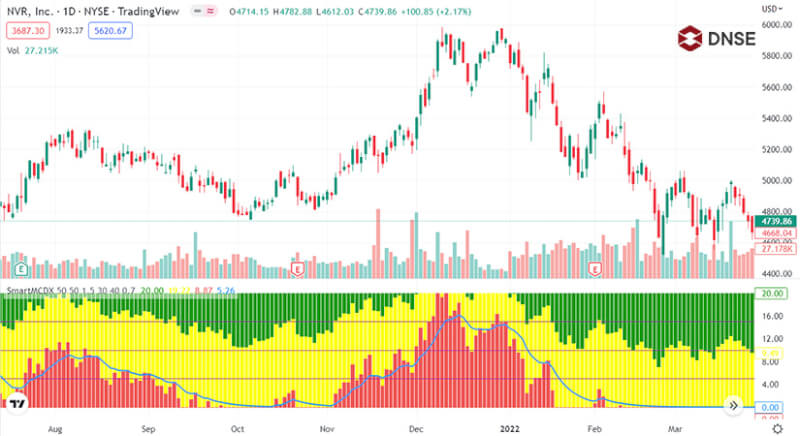
Example structure of the MCDX indicator
MCDX creation process
The process of creating the MCDX indicator includes 3 steps:
- Accumulation: This is the time when large investors “collect goods” when stock prices fall, while small investors do not have complete information.
- Boom: Speculators or large investors push stock prices up, creating attention and a FOMO effect for retail investors.
- Distribution: A lot of good information is released to attract retail investors to buy stocks. This is the time when big investors sell to take profits.
Thus, if only following market information, retail investors will easily be trapped and lose money. To know exactly about the movement of cash flow, investors need to monitor the MCDX indicator. Thereby, you will be able to choose the right time to trade to make an effective profit.
How to trade with MCDX
How to trade with MCDX indicator?
When monitoring MCDX, red appears when large investors begin to enter the market. You should join these investors. On the contrary, when the MCDX chart is not red, you should stand aside and wait.
In addition, based on the 25%, 50%, 75% milestones, investors can compare and determine which stage of the stock’s creation process. Specifically:
- If the red color surpasses the 25% mark: this is the consolidation period for large investors
- If the red color surpasses the 50% mark: this is the stage of pushing the price up
- If the red color surpasses the 75% mark: this is the period when the price increases rapidly because large investors have taken control.
The MCDX indicator helps you accurately identify market trends and fluctuations, thereby making more effective trading decisions.
To take full advantage of the benefits this indicator brings, open a stock account at DNSE today. With an advanced trading platform and a team of experts ready to support, DNSE will help you optimize profits and build a suitable investment strategy. Act now to capture growth opportunities in the market!